
![]() Available to users with the Reports system permission in their role.
Available to users with the Reports system permission in their role.
The Reports tool contains basic and general-use reporting features for data saved in Teamworks AMS. A report lists all records that have been saved to AMS within the specified parameters in the sidebar (i.e. the event form, date range and people whose data is included in the report).
When you use the Reports tool, you choose the event or profile form containing the data you're interested in, then select whose data you want to see and choose any filtering options you need. The Reports tool will then tabulate and display this data for you.
Web
Mobile App
The number of records shown in a report can be set by selecting a total number of records to be shown using the drop-down menu at the bottom of the page. If there are more records than the value selected, the report will consist of multiple pages that can be selected at the bottom of the page.
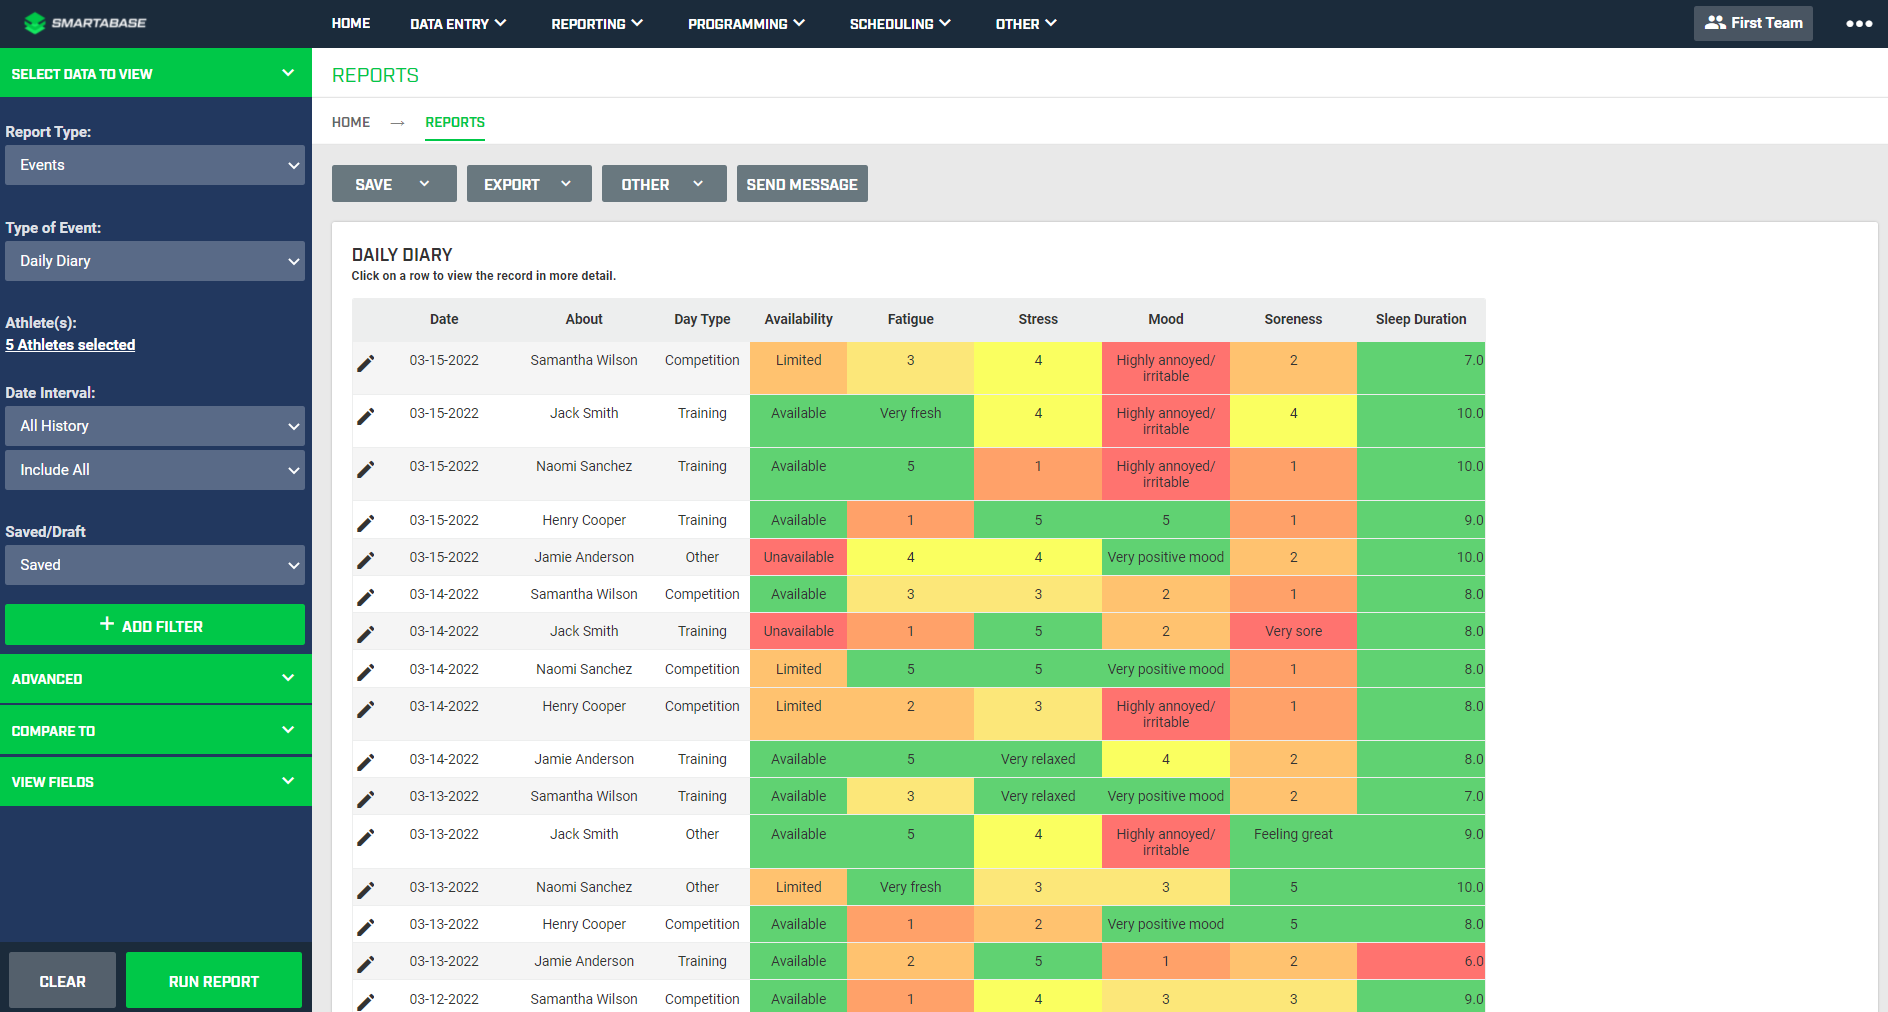
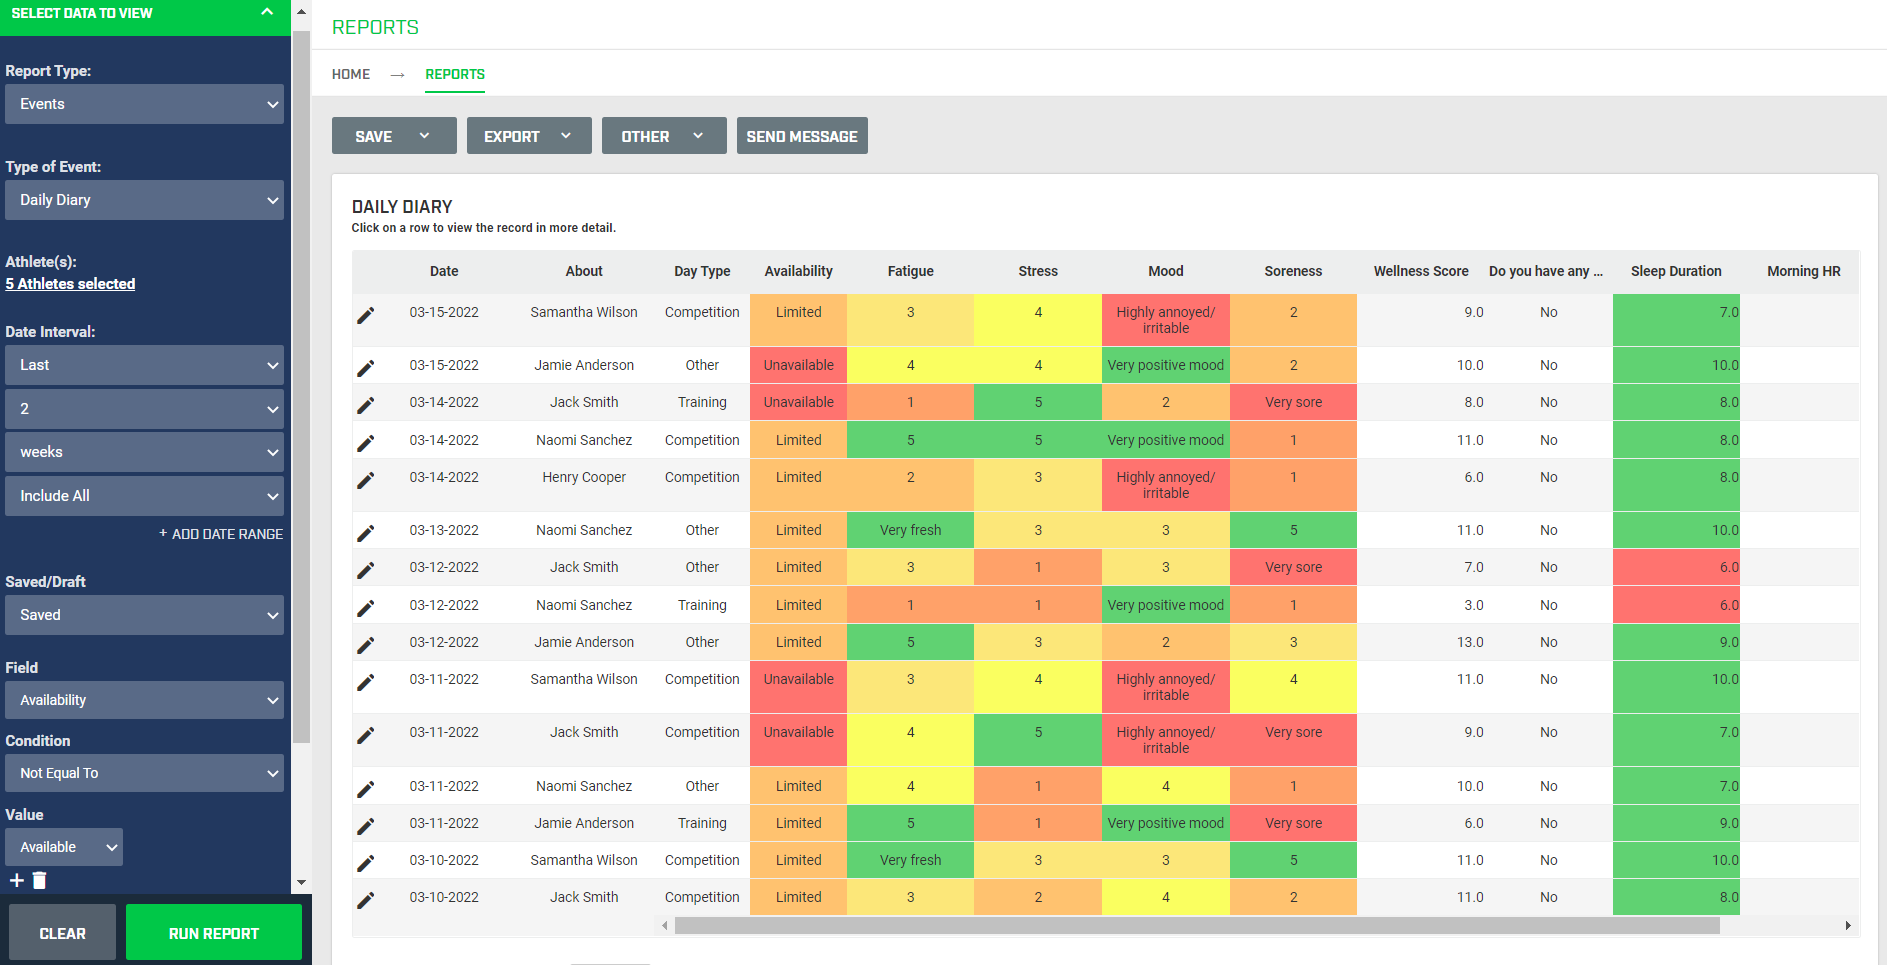
Here's a screenshot from the Reports tool. On the left is the report sidebar which is used for selecting the form, athletes, date interval and other options. Once the report settings have been specified, we used the Run report button beneath to generate the report, which tabulated the data we were interested in. Each row of the report shows one daily diary entry for an athlete, including the color from the relevant performance standard.
When you are looking at the report data, you may have access to the Save, Export and Other menus or the Send Message button at the top of the page, depending on your role.
If your role has the necessary permissions to delete records from AMS, it is important to note that deleting records from the Reports tool will delete all instances of the records shown in the report from AMS.
If you’re a professional user (i.e. you can interact with other people’s accounts), you can run reports from the Reports tabs for any event forms that you have access to. The Saved reports home screen widget will also allow you to access any saved reports from the Home tab.
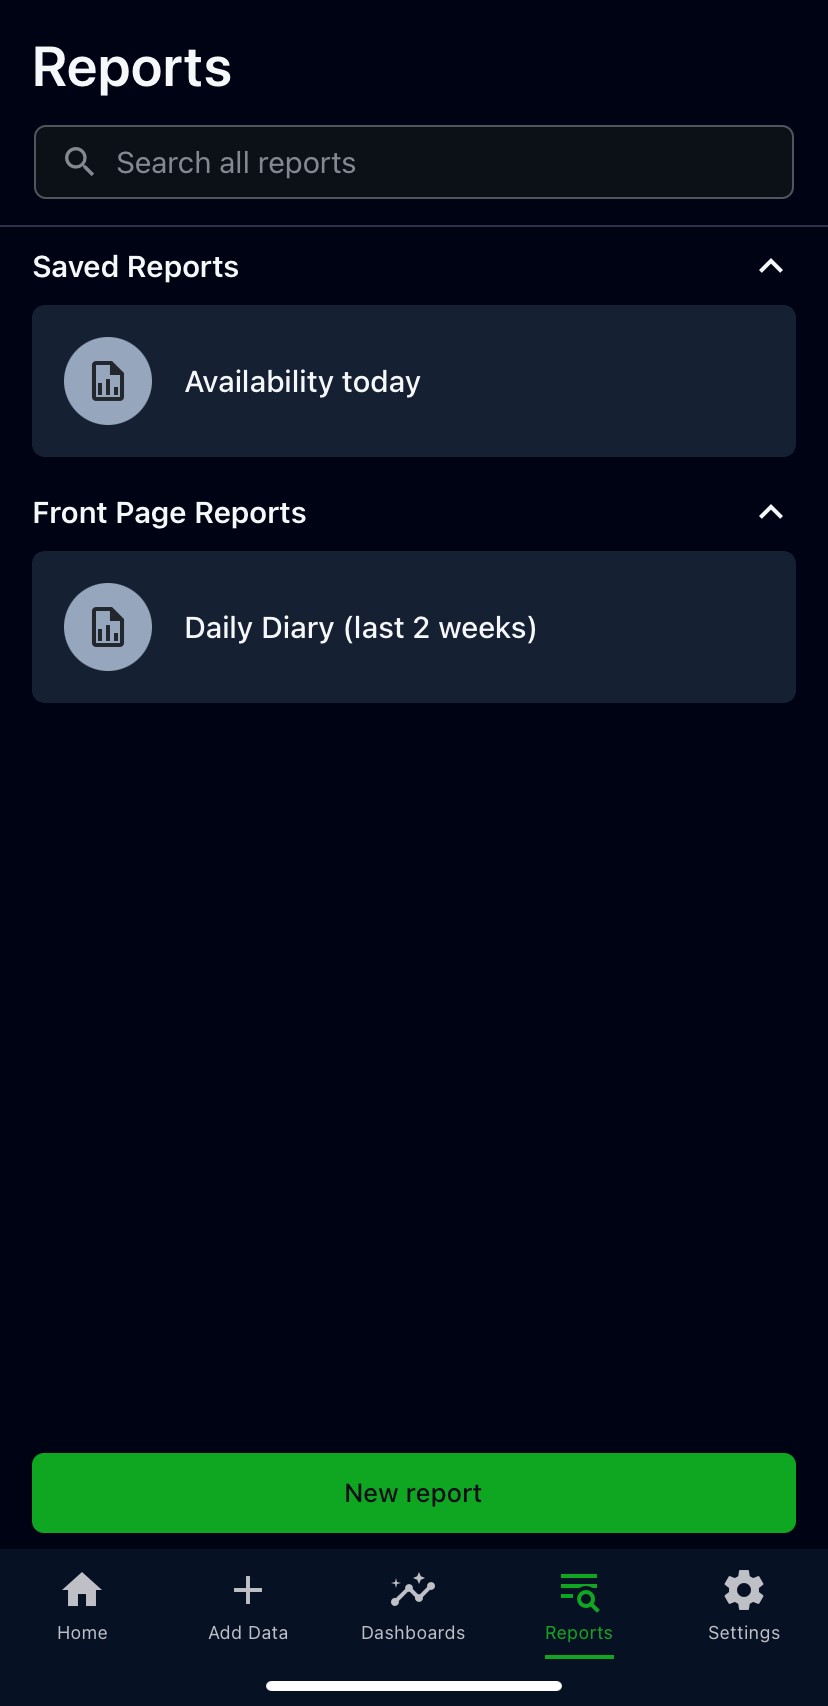
All saved reports and front page reports that you have access to will be listed in the Reports tab. Select from one of these options, or generate a New report with the button at the bottom of the screen.
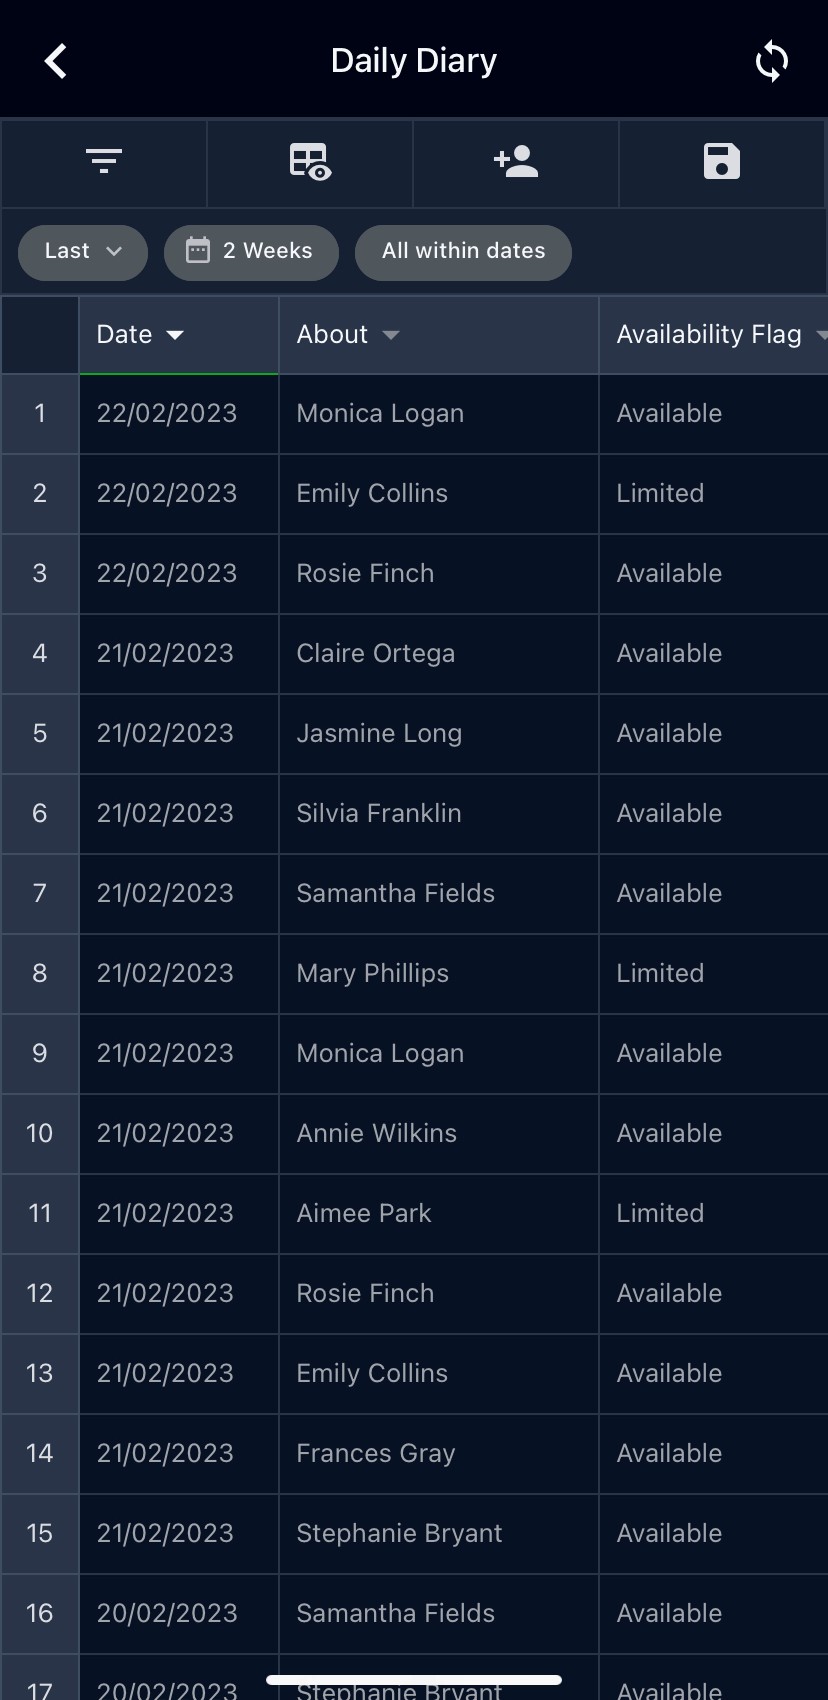
You can sort the report by any field by tapping the column header. Tap the column header a second time to reverse the sorting order. The column that the report is currently being sorted by will be underlined.
Other configuration options are available at the top of the screen. When interacting with any of these settings, make sure to select Apply changes to update the report or cancel the changes by pressing and holding the green bar at the top of the pop-up and swiping down.
To open a specific record from the report (e.g. to view more information or edit the record), select any cell in the row of the report table.
To return to the Reports home screen and view your list of saved reports, select the back button.
Generating a new report
When generating a report for an event or profile form, there are a range of different settings and filters you can apply to review the data.
The choices you make to create a report are applied in the order they're shown in the report sidebar. So, for example, if you choose a date interval of the last 16 weeks and a filter, the results will first be restricted to records from that time period and then filtered to meet the criteria you've set. Similarly, if you set a date interval with a specific start and end date, then set a maximum record number of 4, you'll get the 4 most recent records for each athlete from within that time period.
To generate a report, follow the steps below:
Web
Mobile App
- Open the Reports tool on AMS through a web browser.
- Using the report sidebar menu, configure the relevant settings:
- Choose whether you want to create your report from an event or profile form.
- Select which event or profile form you want to use.
- Select the people to include in your report.
- For event forms, choose how many records to include in the report based on a Date interval and number of records. Since profile forms are not recorded chronologically like event forms, there is no option to choose a date interval or number of results when you run a report about a profile form.
- For event forms, choose whether to include draft records in the report.
- Apply any optional report features.
- Use the Run report button to return your results.
To revert your report selections back to the default settings, select the Clear button in the report sidebar. Clearing a report from the sidebar closes the report but does not delete any records from AMS.
- In the Reports tab, select New report.
- Choose who you are reporting on.
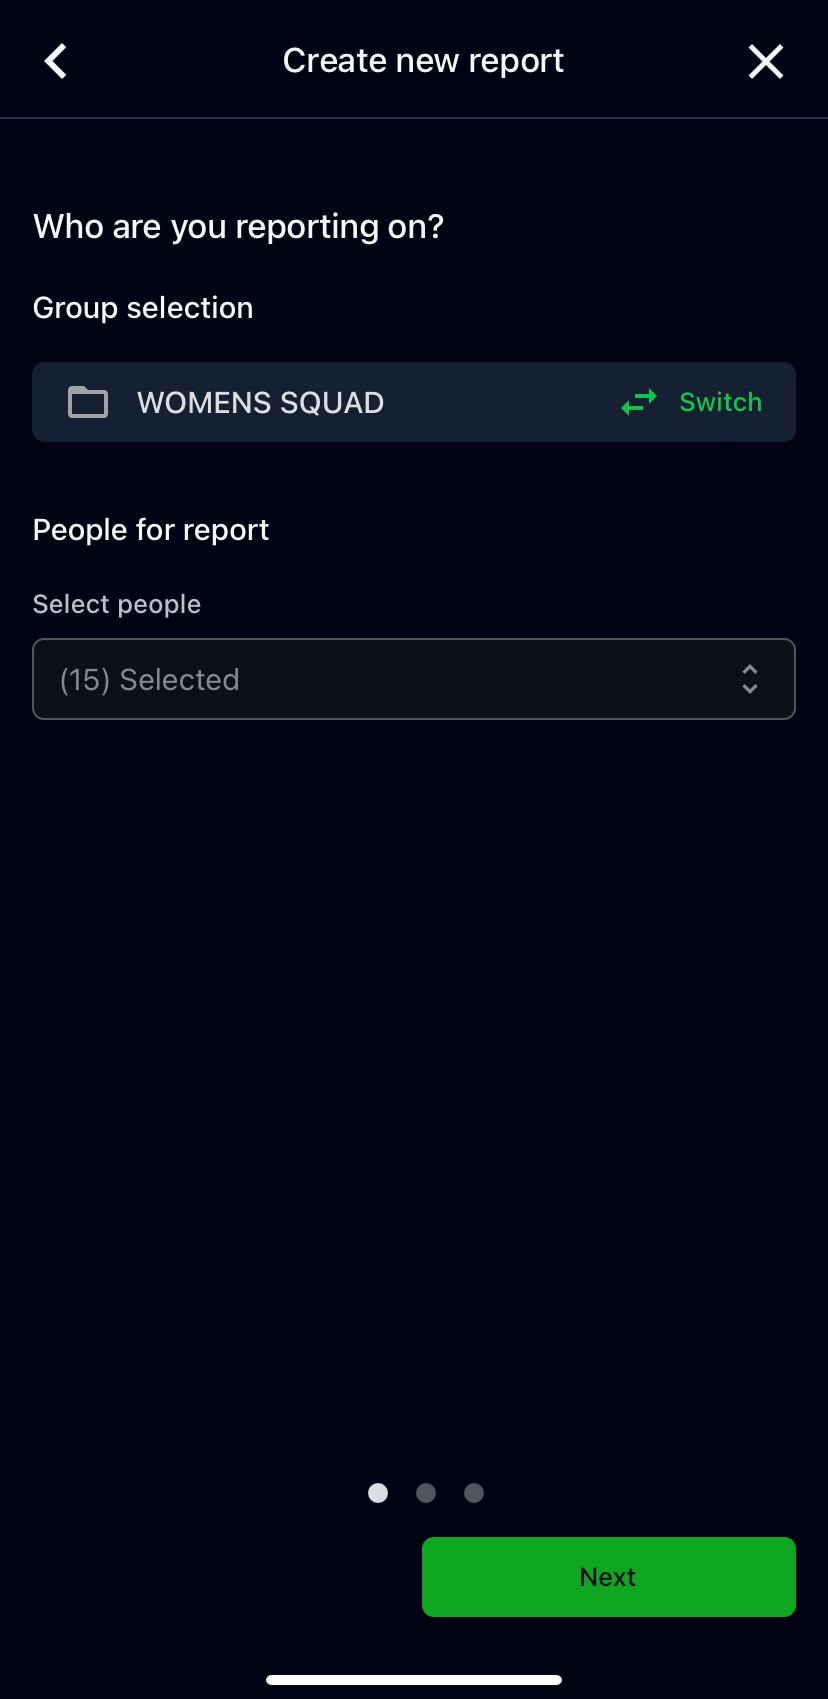
- Select the group that you’re generating the report for. The selection will default to the currently loaded group (including any sub-groups) or you can switch to a different group.
- Select which people from the group to include in the report. All people will be selected by default, or you can remove individuals by selecting the (n) Selected box and untick the box next to anyone you don’t want to include. Select the Apply button to save your selection.
- Select Next.
- Choose what form to report on.

- Select Event or Profile based on the form type.
- Select the specific event or profile form from the Form dropdown menu.
- Optionally apply any filters to the report based on field values. You can add more filters with the Add filter button or remove a filter by selecting the bin icon. Filters are applied in the order they appear: if you had a filter where Availability is equal to Available followed by a second filter where Fatigue is equal to Very tired, the data would look at Available records and then select those with Very tired.
- Select Next to proceed, or Back to edit your previous configurations.
- Choose the time frame for which records to include.
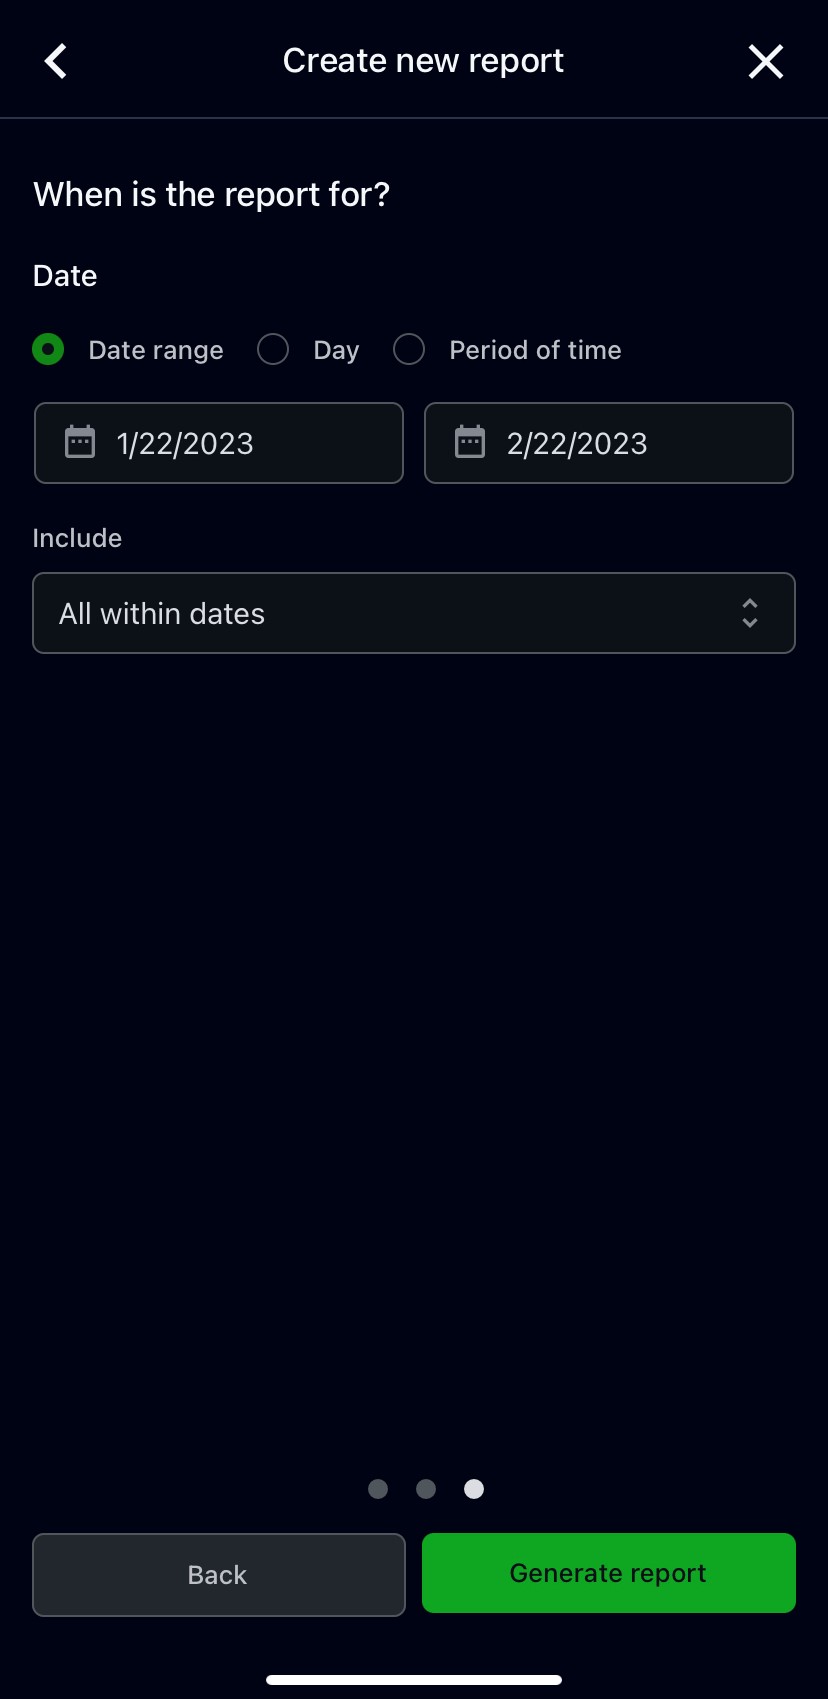
- Use either a Date range, specific date (Day) or Period of time to limit which data is shown in the report. If using Period of time, the following options are available:
- All history: Includes all records entered prior to the current point in time.
- All (history and future): Includes all records entered prior to and after the current point in time.
- All upcoming: Includes all records entered after the current point in time.
- Last: Includes the most recently entered records for a period of time (days, weeks, months or years) that you specify.
- Last custom: Includes the most recently entered records with the ability to control where the week or month starts and ends. For example, a time frame of Last custom - 1 week - Mon-Sun will return all records entered within the last Monday-to-Sunday period. If the report is run on a Tuesday, it will only show records entered in the last couple of days. The same applies for months, except that you specify which day the month starts (e.g. the 1st day or another day).
- Choose how many records within that range to include. All records entered within the range will be included by default, but you can change the dropdown selection to only include the last one to nine entries.
- Select Generate report to proceed, or Back to edit your previous configurations.
- Use either a Date range, specific date (Day) or Period of time to limit which data is shown in the report. If using Period of time, the following options are available:
After running the report, you can use the icons at the top of the screen to customize optional report settings, as well as the following:
- Include or exclude individuals from the selected group. You cannot change the selected group.
- Refresh the report to include recently entered data. If you adjusted any report settings, the report will automatically refresh.
- The time frames that you configured for the report are shown above the table. You can tap any of these options to update your selections.
Optional report features
Optional features include the following:
- Add filters to set criteria for which data should appears in the report.
- Append advanced fields such as account-related details or form metadata.
- Compare the data against a performance standard or another user.
- Show or hide additional form fields (columns) in the report.
- Include people with no data in the report.
- Rank data within the report.
- Group data in the report.
Filtering report data
If you want your report to contain data from a specific time period or meet a certain criteria, you can use the filtering options to narrow the results. To set a filter, select the field name that you want to search within, the search condition and the desired response.
The search conditions will depend on the field type.
| Field type | Condition options | Value type |
| Number | Less than, less than or equal to, equal to, greater than, greater than or equal to, not equal to. | Number |
| String | Contains, equal to, not equal to. | String |
| Date | Less than, less than or equal to, equal to, greater than, greater than or equal to, not equal to. | Date |
| Option (excluding multiple selection field) | Contains, equal to, not equal to. | Options from the field selected. |
In the example below, we’ve created a report based on a daily diary event form, which is filled out on a daily basis and asks athletes whether they're available to train. We set the date interval filter to only show records created in the last two weeks and we also used a data filter to fetch the records where athletes indicated that they were not available.
Adding extra information to a report
If you want to append additional information to a report with details not included in the form you're using, there are three types of options available in the Advanced section of the report sidebar.
- You can add account-related details for the people shown in your report, such as their date of birth, age or group membership.
- It's also possible to append metadata about the records shown in your report, such as creation date or the date of last update.
- You can add data from a profile form to a report about an event form. This includes the ability to filter the event form results using data from the profile form.
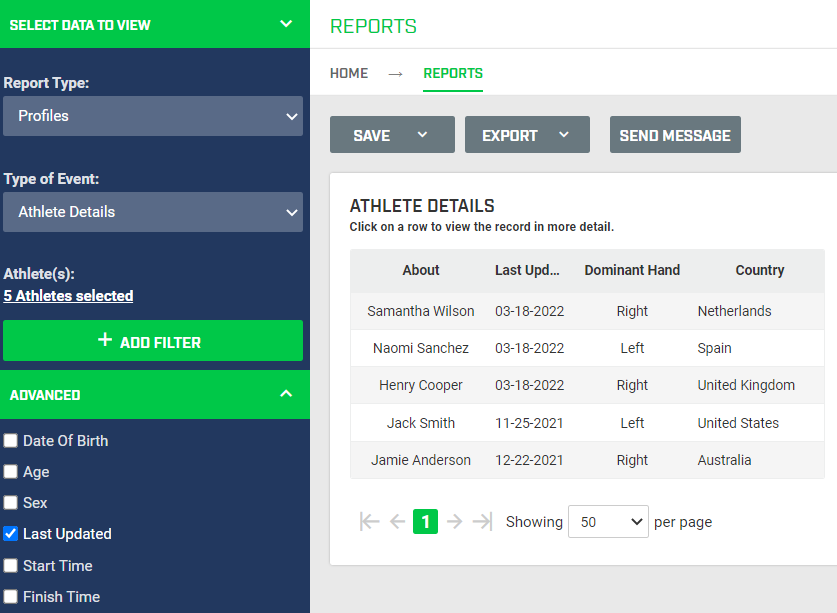
In this example, we've run a report on a profile form and used the advanced option to append the date each person's profile data was last updated.
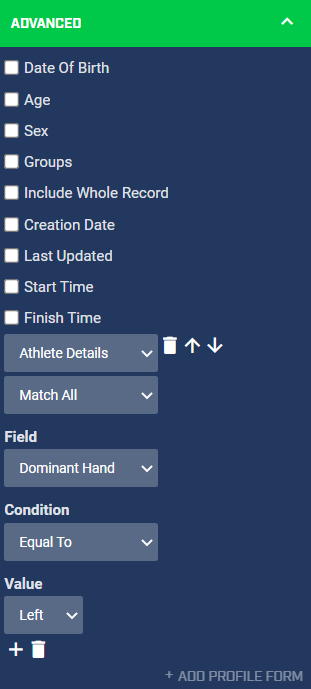
In this example, we've run a report on event form data (not shown) and added the information from the profile form called Athlete Details. We've also used a filter based on the profile data to restrict which event form data is included in the results. In this scenario, the results that are shown for this report would only include athletes whose dominant hand is recorded in the profile form as their left hand.
Viewing comparisons within a report
When you want to change which performance standard is applied to your report or compare data in your report to a particular person, you can use the Compare To section of the report sidebar. This allows you to:
- Choose different coloration using the Performance Standard option. This is useful if there are multiple performance standards for the form, but in many cases you'll only see one option here.
- Automatically create and apply a performance standard based on a specific person's data using the Athlete option. This allows you to choose one athlete from the report results and compare others' results to theirs. For this to be useful, the form must be built with the Best value advanced property enabled.
- Remove a performance standard or athlete comparison from your report using the None option.
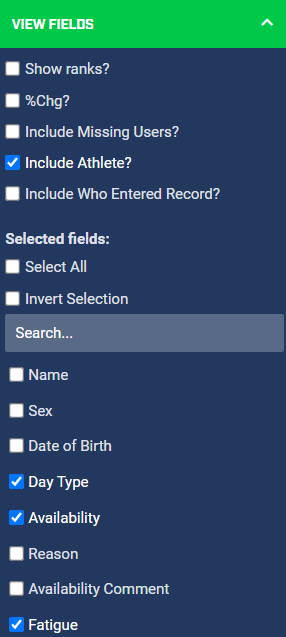
Customizing the fields in a report
You can customize which fields are included in the report by using the View fields section of the report sidebar. By default, reports will show any fields which have the advanced property Show in tables set to True but you can view all available fields and make your own selections in the View fields section. Keep in mind that you will only see fields where their advanced properties are set so that they are visible in the form and in reports. You can also use the tick boxes to select all or none of the fields, or invert your selection. If the form contains a large number of fields, the search box may be useful to help find the relevant field.
The View fields section is also where you can choose whether to include the names of the person who entered the record (By) and who the record is about (About). The default options for these fields are enabled in the form advanced properties.
The default appearance of reports, including the fields shown by default, is set in the builder interface. For more reporting options, please speak to your AMS builder.
Including people with no data in a report
By default, a report will only display records based on the settings applied in the report sidebar. This means that if someone has no records that match the criteria, they will not be included in the report. You can choose to include those people by ticking the Include missing users option in the View fields settings. Their names will be listed at the bottom of the report alongside the current date. The missing users list is generated based on athletes in the currently loaded group who do not have a record on the current page of the report. If there are multiple pages in your report, someone may be included in the missing users list if their record appears on a different page. It is therefore important to ensure that if you are using this feature, your report is set up to include all records on the same page.
Ranking data within a report
Using the View fields section of the report sidebar, you can select to rank any numeric or scored option field. You can also show the percentage change of the data and compare it to the most recent entry or the first recorded record for that person. These options will only be available if a field in the event form has a best value selected in their advanced properties. Enabling the options will display rank and change as a percentage in columns to the right of the field.
Grouping report data
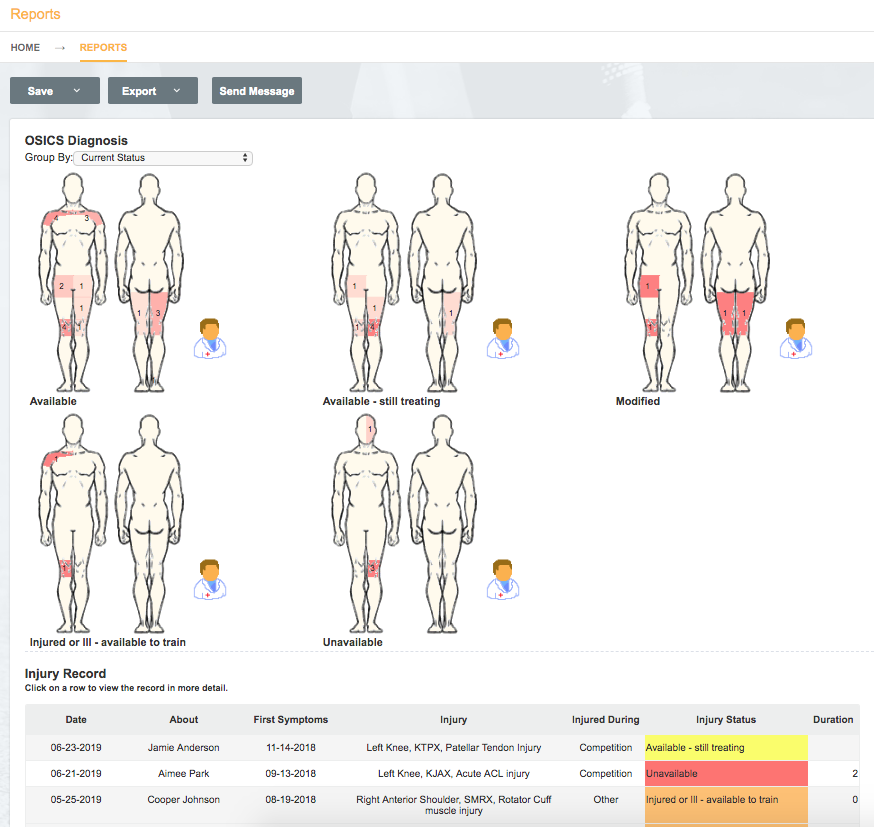
If a form includes a body diagram field, then the Reports tool on the web browser gives you some extra abilities for grouping and visualizing the body diagram data. You can use an option field from the form to show which body diagram data corresponds with each of the options. In the example above, the injury record form contains an OSICS injury diagram field and an option field for the athlete’s current status. We've grouped the injuries in our report by status, which shows us the injuries of unavailable players, players who require modified training and so on. To use the grouping option for reports, follow the steps below.
- Log into AMS through a web browser.
- Open the Reports tool.
- Create a report using the form, date interval, filters and fields you need, including the body diagram field of interest.
- Use the Run Report button to return your results.
- Using the drop-down menu above the body diagram results, choose which option field you want to group the results by.